
Anchoring the Dream
A Diagnostic Analysis of Florida’s Infrastructure and Policy Pathways Using the ADCI

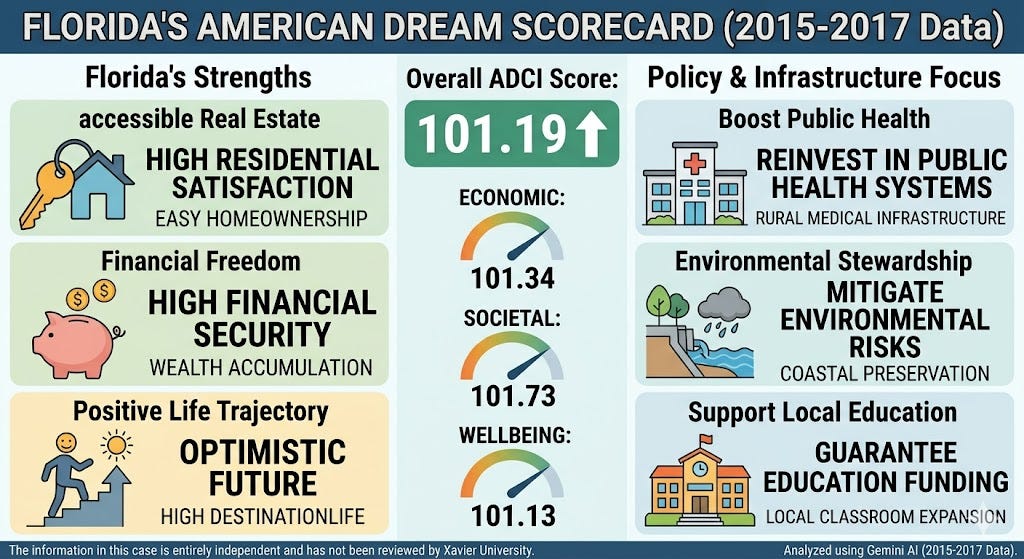
This case study is intended to illustrate the value of the American Dream Composite Index in helping elected officials make better policy and infrastructure investment decisions to enable residents to achieve their American Dream. The three-year data set from 2015-2017 was analyzed using Gemini. These are the last three years available to me. Subsequently, the market research was stopped due to a lack of funding. However, I hope to revive it by securing a new, reliable source of funding. The information in this case has neither been reviewed nor discussed with Xavier University. The perspective is mine alone.
Part 1: The National Landscape (The Warning Signs)
When looking at final, aggregated ADCI scores, most states mathematically balance out, hovering right around the national baseline of 100. True systemic variance doesn’t usually happen across the board; instead, it manifests in sharp, highly localized spikes within specific sub-pillars. To see how a state can maintain high scores across economic, housing, and social categories simultaneously, let’s look at the baseline profile of Florida.
Part 2: The Florida Baseline Synchrony
Florida posts an overall ADCI score of 101.19, classifying it as a statistically significant positive national outlier. Unlike the structural paradoxes seen in other high-population coastal states, Florida’s metric architecture is distinct because its core macro-pillars move upward together in relative alignment:
ECONOMICMacro-Pillar: 101.34SOCIETALMacro-Pillar: 101.73WELLBEINGMacro-Pillar: 101.13
When evaluated through a diagnostic lens, the baseline data footprint recorded the following dynamics:
1. The Real Estate Escape Valve
The Data Baseline: Residential Satisfaction (102.26) and Home Owner (101.65) are firmly above the national average.
Hypothesis
This represents a complete structural inversion of the patterns found in California and New York. It is compelling to hypothesize that Florida historically created a scalable housing environment in which residential expansion outpaced regulatory barriers, enabling citizens to transition from renting to owning property. However, because the dataset measures baseline sentiment rather than local housing inventory or building permit volume, this remains an interpretive theory.
2. Wealth Accumulation vs. Workplace Perks
The Data Baseline: Financial Security (103.67) is a major positive outlier, while Job Benefits (100.69) and Job Environment (99.82) remain closely tied to the average national baseline.
Hypothesis
This specific divergence suggests that residents in Florida derive their sense of financial peace from wealth retention rather than corporate-sponsored employee perks. It is highly rational to hypothesize that Florida’s lack of a state personal income tax allows individuals to accumulate portable personal liquidity, even if the local workplace ecosystem doesn’t offer the elite corporate benefits found in legacy tech or financial hubs. This link between tax policy and the data remains an unproven hypothesis.
3. High Personal Trajectory and Fulfillment
The Data Baseline: DestinationLife (103.19) and SafeCommunity (101.98) log significant positive elevations.
Hypothesis
These metrics indicate a population that expresses high optimism about their personal life direction and a strong sense of safety in their neighborhoods. One can hypothesize that the combination of accessible property equity and financial retention directly yields this sense of lifestyle fulfillment. However, because the dataset aggregates generalized sentiment, mapping these scores to Florida’s geographic climate or regional demographics is purely speculative.
4. The Institutional Trade-off
The Data Baseline: HealthCare (98.74) and Environment (98.50) both exhibit a slight negative drift below the national average.
Hypothesis
While Florida excels in personal and economic security metrics, its public infrastructure sub-pillars display minor deficits. It is a reasonable Hypothesis to infer that a state focused on low tax burdens and rapid residential growth may face a structural trade-off, experiencing minor strain on its public healthcare networks and natural resource management. The dataset lacks the public asset auditing needed to establish this as a direct cause-and-effect loop.
Part 3: Compare and Contrast — Three Different Structural Models
To understand how differently these three mega-states enable their residents to pursue stability, we can chart their raw index scores across core friction points.
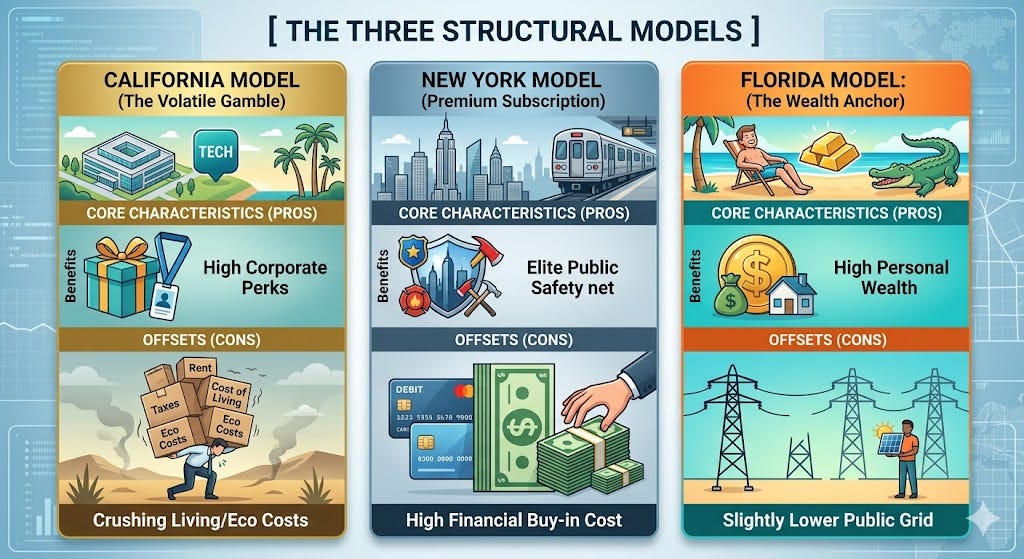
The California Structure: The Volatile Gamble
California’s architecture is deeply fractured. It relies entirely on its high-performing knowledge economy and corporate perks (JobBenefits: 101.69) to insulate its population. However, this model extracts a severe lifestyle toll, punishing everyday residents with a critical environmental deficit (92.40) and a heavily restricted property market (96.34).
Causal Warning: To assert that this specific data structure is the mathematical engine driving the real-world population exit to the Sun Belt is a Hypothesis.
The New York Structure: The Premium Subscription
New York presents a model of unified, institutional strength. It successfully converts its immense economic power (102.46) into elite healthcare safety nets (104.20), strong neighborhood safety (102.42), and robust public transit grids (104.09). However, the data highlights a steep cost of entry, forcing residents to absorb a notable homeownership deficit (97.68).
Causal Warning: Hypothesizing that this specific framework causes a “subscription fatigue” that prompts wealthy residents to move once they stop utilizing the public grid is a Hypothesis.
The Florida Structure: The Wealth Anchor
Florida rejects both the K-shaped fracture of California and the high-tax institutional model of New York. It operates as a personal wealth anchor. By sacrificing corporate perks (JobEnv: 99.82) and accepting a slightly below-average healthcare grid (98.74), Florida achieves the most balanced real estate and personal optimism scores in the comparison (HomeOwner: 101.65, DestinationLife: 103.19).
Causal Warning: Declaring that Florida’s business-friendly regulatory framework or lack of state income tax is the direct structural cause of these high homeownership and financial retention scores is a Hypothesis.
Part 4: Where Policy Can Better Enable the Dream (Florida)
If Florida policymakers were to use the ADCI's sub-pillar deficits as a forward-looking diagnostic tool, their mandate would be the exact opposite of New York's and California's. They do not need to fix the housing market or lower personal tax pressures. Instead, their priority must be to reinvest their realized economic capital into bolstering their trailing public infrastructure.
The data highlights several specific structural pathways that could be prioritized:
Reinvest Surplus into Public Health Systems: To address the state’s slight negative drift in HealthCare (98.74), policymakers could direct revenue into expanding rural medical infrastructure and funding community health clinics. Strengthening the public medical grid ensures that rapid population growth does not dilute the quality of care available to lower-income residents.
Proactive Environmental Mitigation: To protect the state’s razor-thin margin in Environment (98.50), capital outlays could be directed toward regional water management, coastal preservation, and stormwater infrastructure upgrades. Addressing these vulnerabilities early prevents natural geographic risks from eroding long-term residential satisfaction.
Transition to Localized Educational Capital: While Florida’s access to basic education sits above average (101.54), rapid residential expansion can quickly overcrowd local classrooms. Guaranteeing non-discretionary funding streams to local school boards for physical school construction protects the neighborhood-centric social fabric documented in the dataset.